Buyers typically utilize a historical multiple of EBITDA to arrive at a valuation for an electronic distributor. However, a positive operating income on the Income Statement does not guarantee a high business value. A distributor’s business might look profitable (positive operating income) but may not be financially strong if cash is tied up mostly in working capital.
Let’s assume two distributors have nearly identical revenue and operating income. Which business is more valuable? You must look past the Income Statement to answer that question.
ROWC (Return On Working Capital) is a non-GAAP financial metric that compares operating earnings for a measurement period to the related amount of working capital. This is defined as follows:
- ROWC:
- ROWC = EBIT / Working Capital
- ROWC = (EBIT/Revenue) * (Revenue/Working Capital)
- ROWC = Operating Margin * Working Capital Turnover Ratio
- ROWC = Operating Margin * (365 / Working Capital Days)
- ROWC = Operating Margin *( (365 / (DIO + DSO – DPO))
- Note that we have ignored cash as well as the cost for short term borrowing. Distributors typically have minimal cash and instead rely on receivables and inventory turns to generate cash. Short term lending costs are typically constant.
- To generate wealth a distributor needs to have an ROWC in excess of its cost of capital.
Example:
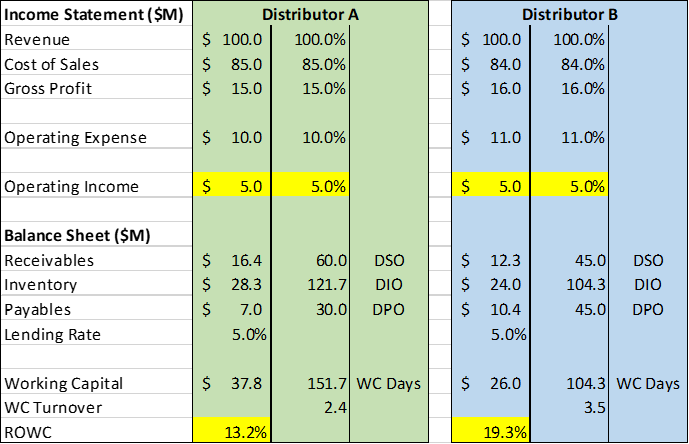
The chart below outlines two hypothetical distributors (A & B). The Income Statement reveals that both have identical revenue and operating margin. Typical valuation methodologies would in fact indicate that both distributors would qualify for the same valuation. However, let’s look at the Balance Sheet, examine working capital employed, and calculate ROWC. Doing so we find that Distributor B has a much higher ROWC (19.3%). This distributor utilizes $11.8M less working capital to achieve the same operating profit. Distributor B is able to do this by improving collections by 15 days, increasing inventory turns by ½, and successfully negotiating a 15-day increase in payable terms with suppliers.
The 5 leverage points of ROWC:
To illustrate the five leverage points of ROWC let’s take the previous example and illustrate what would be required to increase the ROWC by 2% for each of the 5 levers.
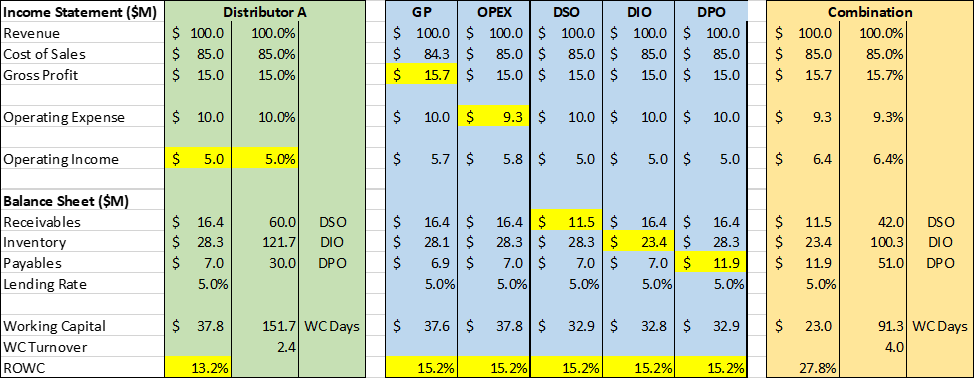
- GP%: Increase GP% (Gross Profit Percentage) by seven tenths
- OPEX: Decrease OPEX (SG&A expenses) by seven tenths
- Receivables: Reduce DSO’s (Days Sales Outstanding) by 18 days
- Inventory: Increase DIO (Days Inventory Outstanding) by 21.4 days or increase turns by .64
- Payables: Increase payables by 21 days
Finally, combining all 5 leverage points would increase ROWC from 13.2% to 27.8%. As illustrated below working capital is reduced from $37.8M to $23M. This level of working capital performance would translate into a premium valuation.

Industry Leaders:
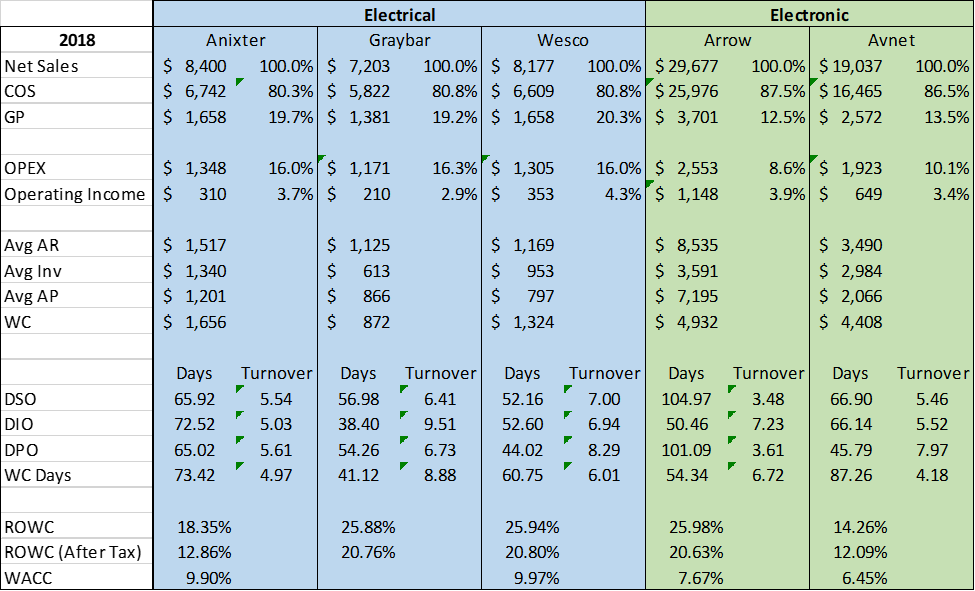
The chart below summarizes key 2018 YE financial data for the leading electrical and electronic distributors. ROWC for WC employed is calculated based on 2018/2017 averages.
- Electrical and electronic leading distributors have similar operating income percentages despite having significantly different gross margin percentage and OPEX percentages.
- All 5 companies have an after tax ROWC significantly above their WACC which indicates they are effectively managing working capital employed and creating wealth.

Summary:
In the case of electrical or electronic distributors, a positive operating income combined with traditional valuation methodologies does not guarantee high value in a sale of the company. A commercial distributor may look profitable (positive Operating/Net Income) but may not be a viable acquisition target if cash is tied up mostly in Working Capital. ROWC is an important financial metric for comparing operating earnings with working capital investment. Buyers of electrical/electronic distributors will be looking at these key indicators of value and owners should as well before going to market.
